AI Recommendations Don’t Have a Winner Yet — And That’s the Whole Story
AI Recommendations Don’t Have a Winner Yet — And That’s the Whole Story
Everyone’s panic-buying GEO services because “LLMs will crown one brand per category forever.” A new empirical study across 3,750 model responses says the throne room is mostly empty — and even where someone sits on it, a different model will hand the crown to someone else.
What happened
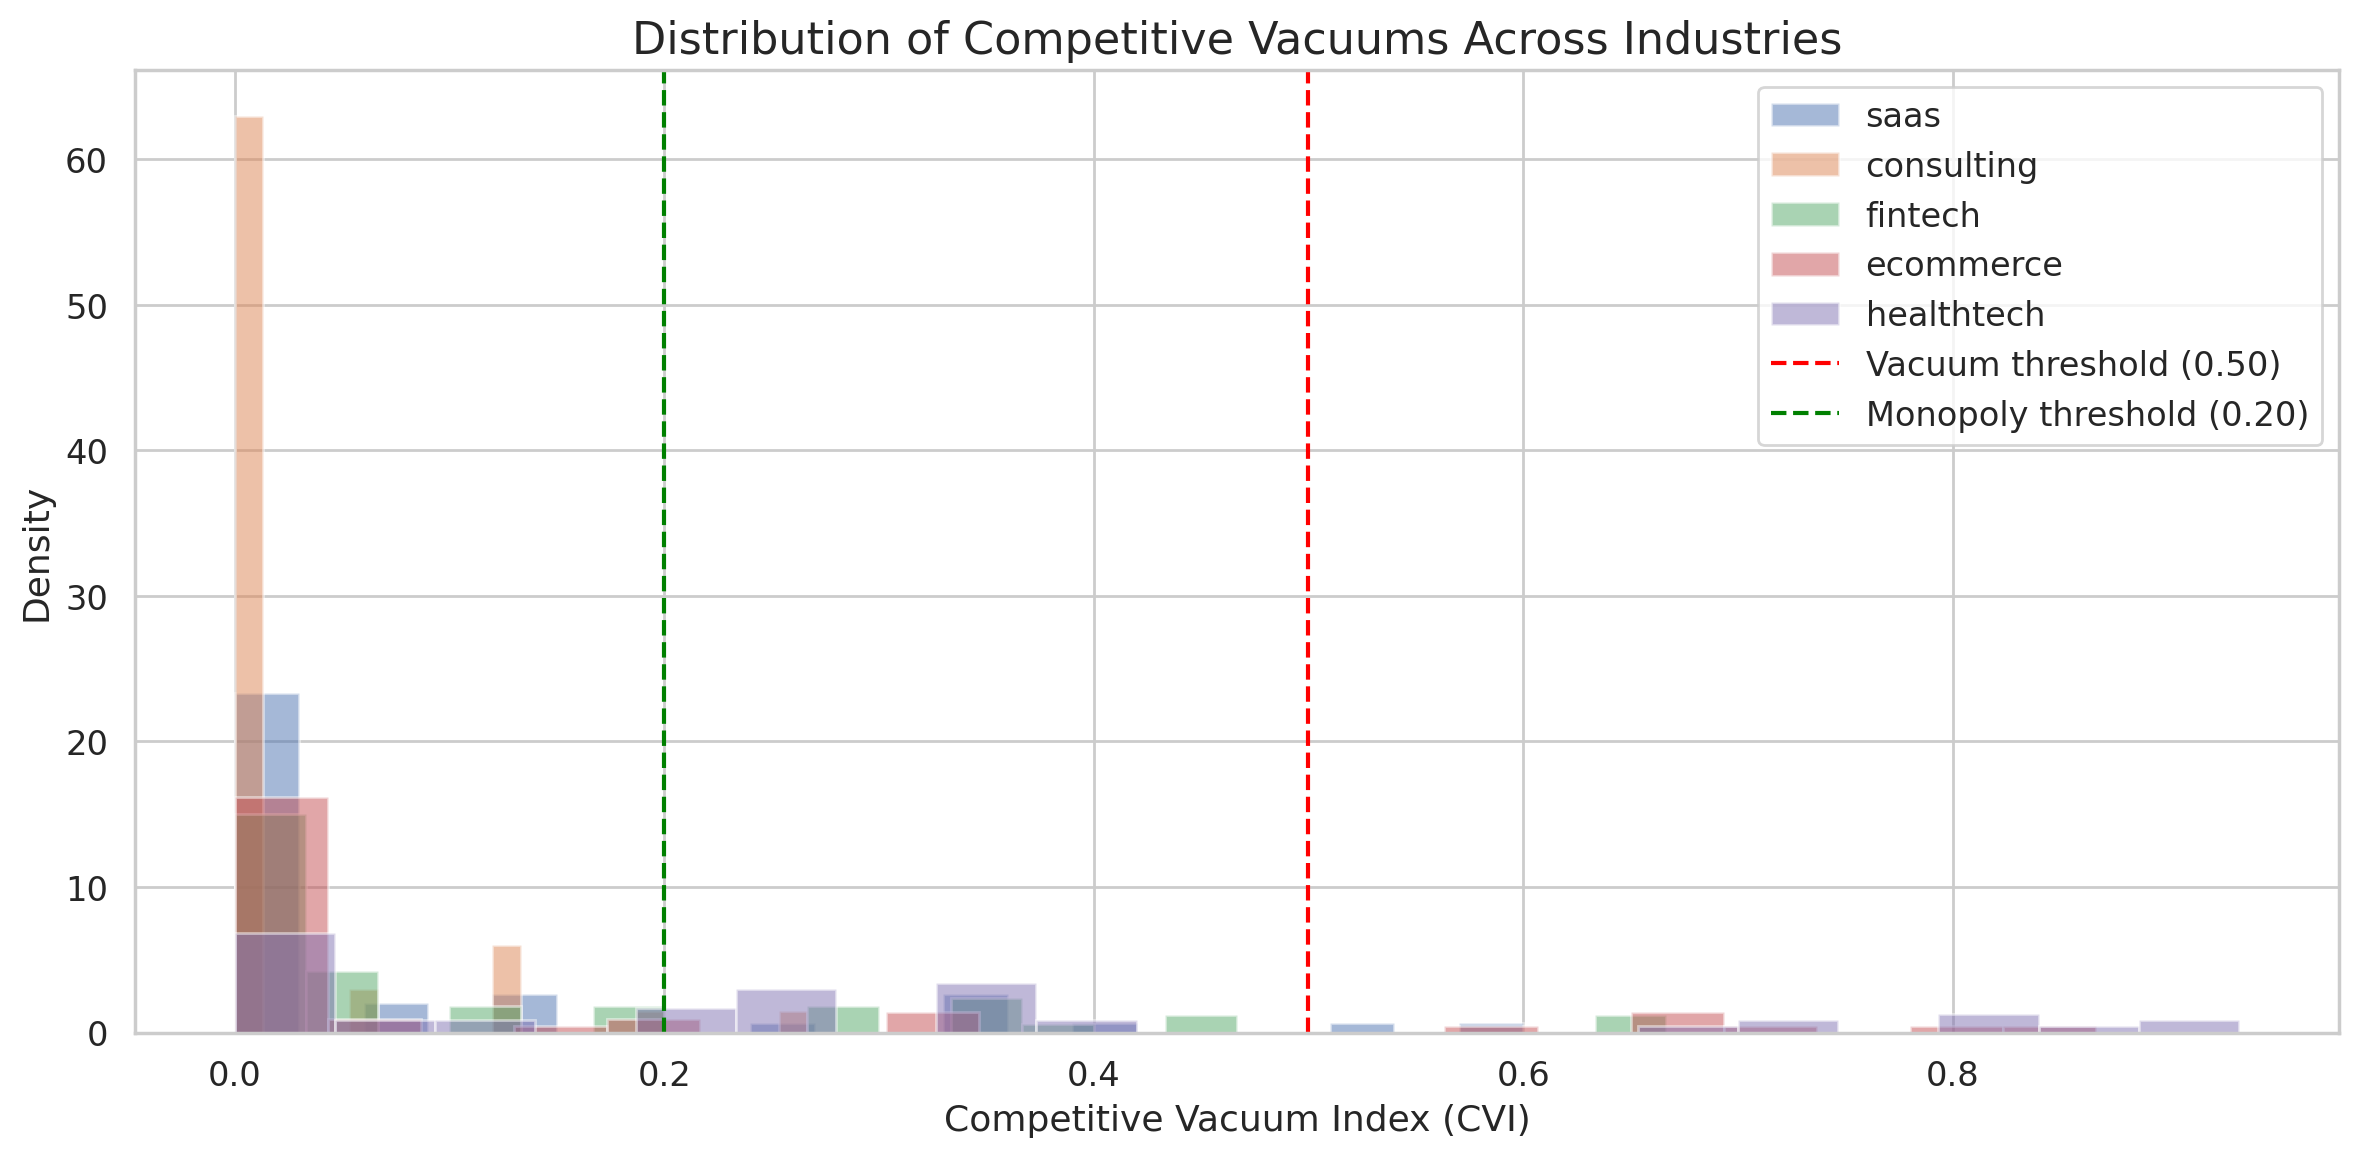
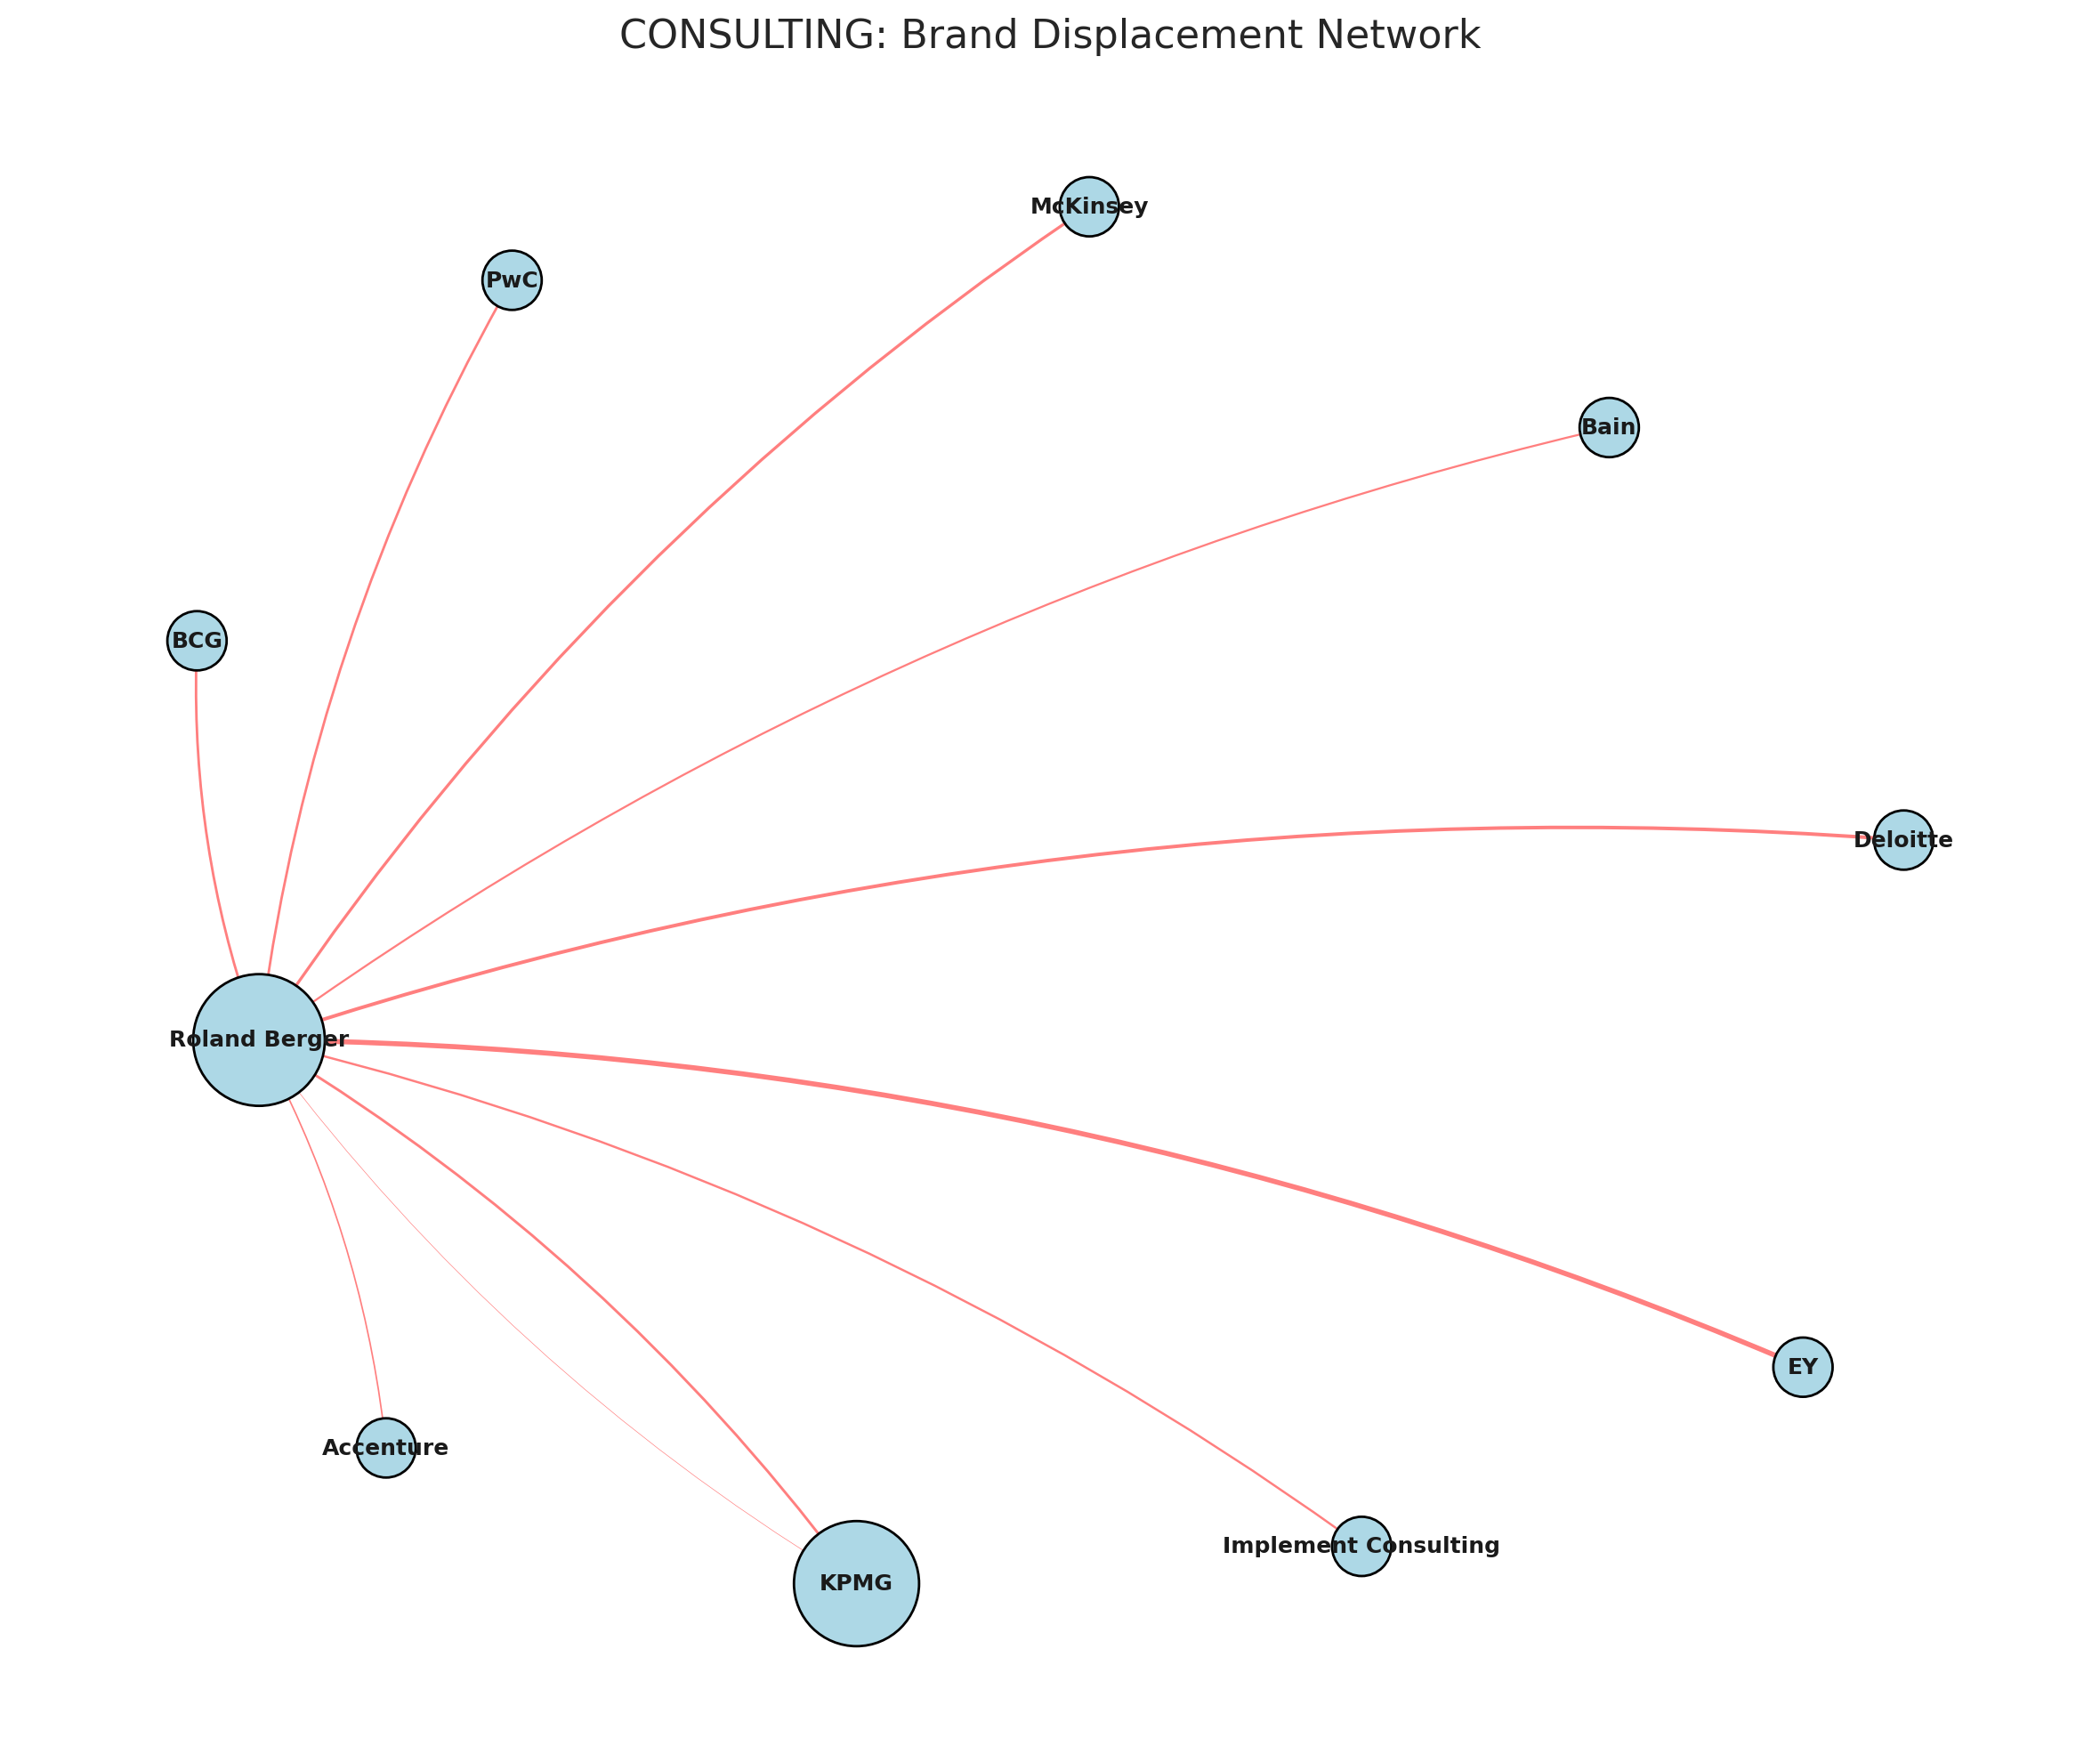
Researcher Dmitrij Żatuchin ran 250 brand-free category queries across GPT-5.2, Google Gemini 3 Flash, and Perplexity sonar-pro — five times each, covering 50 brands across five industries — and built three new metrics to measure who actually owns the AI recommendation slot. The headline number that deflates the hype: the mean Gini coefficient of recommendation concentration was 0.28 (95% CI [0.16, 0.41]), well below the 0.60 power-law threshold the author used to define winner-takes-all dynamics. Cross-model agreement on the top-recommended brand landed at just 41.6%, meaning a brand that leads on one model loses that position on another more than half the time. Share of voice in AI recommendations is fragmented, not monopolized. Competitive vacuums — categories where no sampled brand dominated — appeared in only 8% of queries, so models do name brands reliably, but they don’t reliably name the same brand. Displacement (the degree to which recommending Brand A crowds out Brand B) was heavily industry-dependent: as gentle as 0.4:1 in consulting and as lopsided as 4.3:1 elsewhere, with a mean of 2.4:1. The paper proposes three reproducible metrics — Category Ownership Index (COI), Competitive Vacuum Index (CVI), and Displacement Score (DS) — as a candidate framework for AI visibility competitive intelligence.
Cold read
This is exploratory research that is honest about being exploratory — the author uses the word “candidate” and calls for future validation, which is the right posture but also a flag: none of these metrics have been validated against real purchase behavior or actual customer journeys. Fifty brands across five industries is a convenience sample, not a representative cross-section of the economy; the results almost certainly don’t generalize to, say, hyper-niche B2B software or regulated industries. The “dice-roll stability protocol” (repeating queries five times) is a reasonable start at measuring Temperature (sampling) variance, but five repetitions is thin for statistical confidence in any single brand-model pair. The Gini coefficient of 0.28 is being used to argue against winner-takes-all, but a mean hides the distribution — some categories could be at 0.55 while others drag the average down; we don’t get that breakout. And the models tested — GPT-5.2, Gemini 3 Flash, sonar-pro — will change their weights, training data, and prompt-level ranking behavior; any snapshot study like this has a built-in expiration date measured in quarters, not years.
What it means for you
- Signal maturity: 2/5 — Interesting metrics, small sample, zero real-world validation
- Who gets hurt: Agencies selling GEO/LLMO retainers on the premise that “one brand wins per category” — this data undercuts the urgency of that pitch
- What breaks if this is true: The entire investment thesis for brand-capture AI optimization collapses into a much messier, multi-model, category-specific problem with no clean playbook
- Why it might not land: 41.6% cross-model agreement isn’t low depending on your baseline; and concentration could accelerate fast as models are fine-tuned and RAG pipelines get tighter — today’s 0.28 Gini may not be next year’s
- Watch for: A follow-up study (by this author or others) that maps COI/CVI/DS scores against actual referral traffic or conversion data from brands with AI-driven discovery attribution — that’s when this framework either earns its keep or gets quietly retired
Forecast as of 2026-06-23
By Q2 2027, at least one major marketing analytics platform (think Semrush, Ahrefs, or a well-funded GEO startup) will productize metrics structurally equivalent to COI or DS — but the underlying Gini concentration numbers will have risen above 0.40 in at least two of the five industries studied here, as model providers consolidate their training pipelines and enterprise licensing deals begin influencing recommendation outputs.
Source: Who Owns the AI Recommendation? A Multi-Industry Empirical Map of Brand Category Ownership Across Large Language Models — Dmitrij Żatuchin. https://arxiv.org/abs/2606.23057v1